In the world of Forex trading, one aspect that is literally unavoidable is the change of prices, and these changes occur constantly. Whether they be due to economic, political, social, or any other events, these price changes do occur, and they can sometimes have a massive potential to completely change the course of your trading endeavors. This doesn’t necessarily mean that it’s bad. After all, the changes in prices are how to make profits, and this is trading in a nutshell.
The point here is that these changes should not be looked at in a bad way, as something negative. Rather, they can be utilized to create new opportunities for profit. This is definitely the case, as a good trader doesn’t care in what direction the prices will go eventually. At the end of the day, what they care about is that they make the right prediction about the movements of these prices.
And this is precisely the reason why we have, as an industry, going through so many new technologies and tools over the years. Computer software, statistical concepts, tools and algorithms, countless pieces of research – all of this is something that has made financial trading much more accurate, and therefore, profitable. If one is to be a successful trader, it is imperative that they make use of these tools, and that they make use of these tools in the right manner.
In this guide, we will be talking about one such tool and concept – the expanding triangle Elliott wave theory – which has proven to be invaluable for thousands of traders over the world. When used right, this approach can yield amazing results, and can change the course and results of trading significantly. So, without further ado, let’s dive straight into it!
Elliott Waves expanding triangle pattern Forex – a brief overview
Before we discuss the expanding triangles and all of its possible applications, let’s take a quick look at its actual origin – where did it come from, and who created it. The man behind the expanding triangles pattern is Ralph Elliott – an American accountant and an author. Elliott was always very interested in the stock market and found a deep fascination with it. He studied the stock market for years and came up with many different ideas and theories on how it worked.
At some point, he developed his waves principle, which, along with his expanding triangles theory, are still used quite extensively in the financial market. According to Elliott, the performance of stock markets, and the direction it goes to, is heavily dependent on human psychology, as our behaviors and impulses were ultimately what controlled the market’s direction.
One of the biggest Elliott Wave rules – or rather, you could say beliefs – was that market psychology was one of the most important factors affecting its downward or upward moves, and this is actually what the theory is based on, which is examining and analyzing the market’s downward and upward moves.
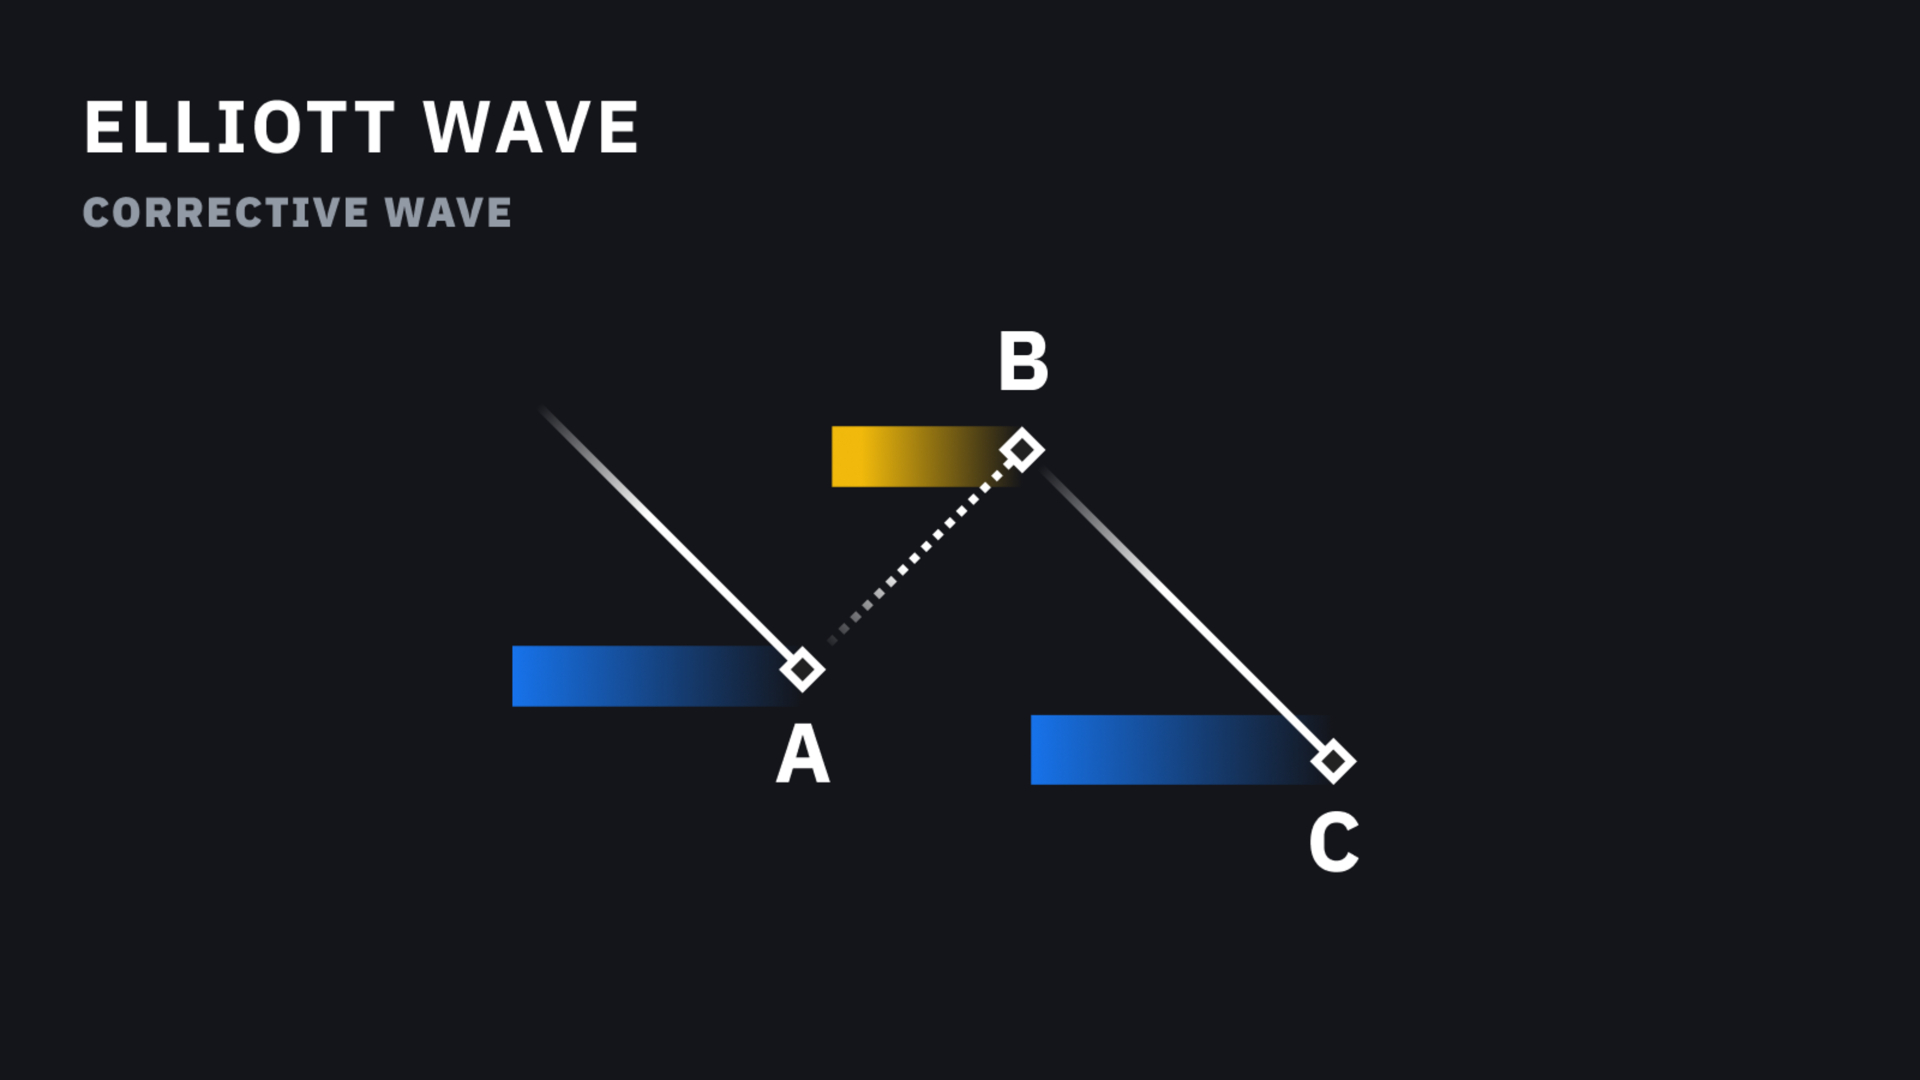
Market psychology, therefore, plays an important role in any upward or downward move, and this is the very starting point the whole theory is based on interpreting the upward and downward swings the market experiences. Perhaps the biggest discovery that Elliott made was that regardless of the market being bullish or bearish, it all takes place in five different parts, or, rather, as it would be appropriately called, waves. This is what gave way to the concept of Elliott Waves. According to Elliott, the market goes upwards or downwards in a five-wave manner, and this is always followed by a three-wave correction in the other direction. This, in a nutshell, is the Elliott Waves theory.
Corrective expanding triangle chart pattern
With that being said, it can’t possibly be that simple, can it? Well, according to Elliott himself, this is not fully the case and is sort of an illusion. Elliott has put forward numerous cycles, that all intertwine with each other. He referred to the interactions between corrective and impulsive waves “cycles”, and stated that in order to get a reliable assessment from these cycles, it was necessary to look at a chart with a large number of these cycles.
What is also conducive to this theory is the fact that the Elliott Wave’s triangle trading strategy requires that one take a descending approach in terms of timeframes, meaning that one has to start from a yearly/monthly timeframe, and slowly descend to the shorter timeframes such as weeks, days, hours, etc.
As mentioned, one of the unavoidable eventualities in the Forex market is the change in prices quite openly, meaning its volatility. However, on the other hand, at times, these changes are actually going in certain directions, following a defined and predictable trend.
According to Elliott, this is not something that happens at random. Rather, this happens through the cycles of impulsive and corrective patterns. With each and every price change – increasing or decreasing – which will be occurring in an impulsive five-wave pattern, a three-wave corrective pattern will follow and take the price in the opposite backward direction, which makes everything a bit more stable, relatively speaking.
This would mean, that the main way the markets consolidate and become more stable, is through these very triangles. As mentioned, according to this theory, the triangle patterns have three waves, but in entirety, the whole “process”, so to speak, has five separate legs, which Elliott names with alphabetical letters A to E.
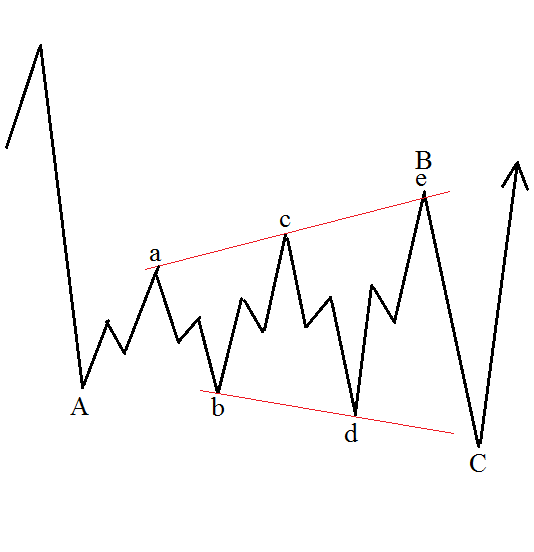
As to the actual process of identifying these triangular patterns, it’s pretty simple – simply look for an occurrence of a sequence of three highs and lows, which can either be lower-lows, higher-highs, higher-lows or lower-highs. This will depend on the respective one of the Elliott Wave charts.
Beyond that, another important part in pinpointing a corrective triangle pattern is having two trendlines in a chart. These two have to meet in the ends of a-, c- and e- waves and the ends of b- and d-waves. After this, the two triangle patterns will be discerned based on the directions of these trendlines. In case of these trendlines going to each other towards one mutual point, we’ll be facing a contracting triangle, and in case of them distancing themselves from each other, it’ll be an expanding triangle. This means, that there are two types of corrective triangles, the contracting one and the expanding one.
Clarifying the contracting triangles
Before we move towards the explanation of expanding triangle pattern Forex specifics, we believe it’s important to clarify the contracting triangles, as it will help you get a clearer picture of how this all works.
Of course, going by their name alone, it would be understood that these two would be different from each other, but a curious part is that contracting triangles are a much more frequent occurrence than expanding ones. This would mean, that the price of an asset, over time, becomes much less volatile, and increasingly posts higher lows and lower highs. This particular occurrence, in usual, takes place before major economic news is revealed, when everybody is tensed and waiting for something big to be announced.
After said hypothetical announcement is made, the volatility falls quite a bit, and very fast at that. After this, the contracting triangle goes higher or lower than the trendline that’s previously determined. This process takes place after pretty much every stabilization as the volatility of an asset keeps decreasing until the price goes past a significant increase or decrease.
The expanding triangle pattern
At long last, we have finally come to the point of discussing the expanding triangle pattern, how in particular it works, how much importance it has, and why you should care.
We have already mentioned, that they occur much less frequently than the contracting ones, and the reason is their intensive nature. According to Elliott, it’ll often be the case, that these fluctuations in the prices will be very intense, and each separate leg of the triangle will be considerably larger than the one before it, resulting in an extending triangle on the rising triangle chart.
As an expanding triangle forms, logically, it sends signals with conflicting information, which itself would result in a lot of irrational decisions and choices made by them, ejecting them from their position/trade. Here is a specific example that you are likely to encounter:
Theoretically, let’s assume that you see a- and b-waves taking place, and let’s assume that the b- is looking to be more prevalent than the a-wave. Naturally, your first thought would be to quickly open a position in favor of the b-wave, while simultaneously making a stop-loss.
According to the rules of expanding triangle waves, the following c-wave will be much stronger than the b-wave and will be going towards the opposite direction. As such, not only will you be working against yourself and your position, but the position will be going way over your placed stop-loss, and result in a losing trade.
However, there’s more – let’s assume the other traders see what’s happening, and they decide to follow along the c-wave, assuming that it’ll keep going in the same direction, and place a stop-loss at its beginning. What’s going to happen is that a new d-wave will surface, going in the opposite direction, eventually surpassing the c-wave’s lowest point, activating the stop-loss and getting the traders out of the trade.
This, of course, is a very simplified example of a rising triangle Forex scenario, but this is actually how it all works. This is quite a usual and common outcome in the cases of an expanding triangle. In our example above, the concluding point would be when the final, e-wave, stats going in the opposite direction again, at which point, many of the traders would be full of confusion. This, of course, will result in many of them choosing to refrain from opening any more trades, wrongly assuming that the e-wave will never stop. All of this is, of course, all the proof in the world we need in favor of Elliott’s theory that the human mind and psychology plays a critical key role in how the markets perform, and which direction they go to.
A closer look at the Elliott wave triangle patterns – different types, and their mechanism of operation
Now that we have established a basic overview of what the expanding triangle theory is and how it works, it’s time to expand on what we know (no pun intended). As you will learn in this section, there is not one, but actually thee types of expanding triangles. As mentioned, the explanation above was quite introductory, and there is actually more to it than that, and the whole theory of expanding triangles is quite a bit expansive and multi-faceted.
In fact, there are three separate types of expanding triangles, and for any trader who’s interested in utilizing the expanding triangle pattern/theory to its fullest potential, it is imperative that they get familiar with all three types, and understand exactly how they all work. The three major types for expanding triangle technical analysis are the following:
- The Horizontal Expanding Triangle
- The Irregular Expanding Triangle
- The Running Expanding Triangle
Let’s dive into each one of them separately, describe how they all manifest themselves, and what you should know to utilize them to their fullest potential.
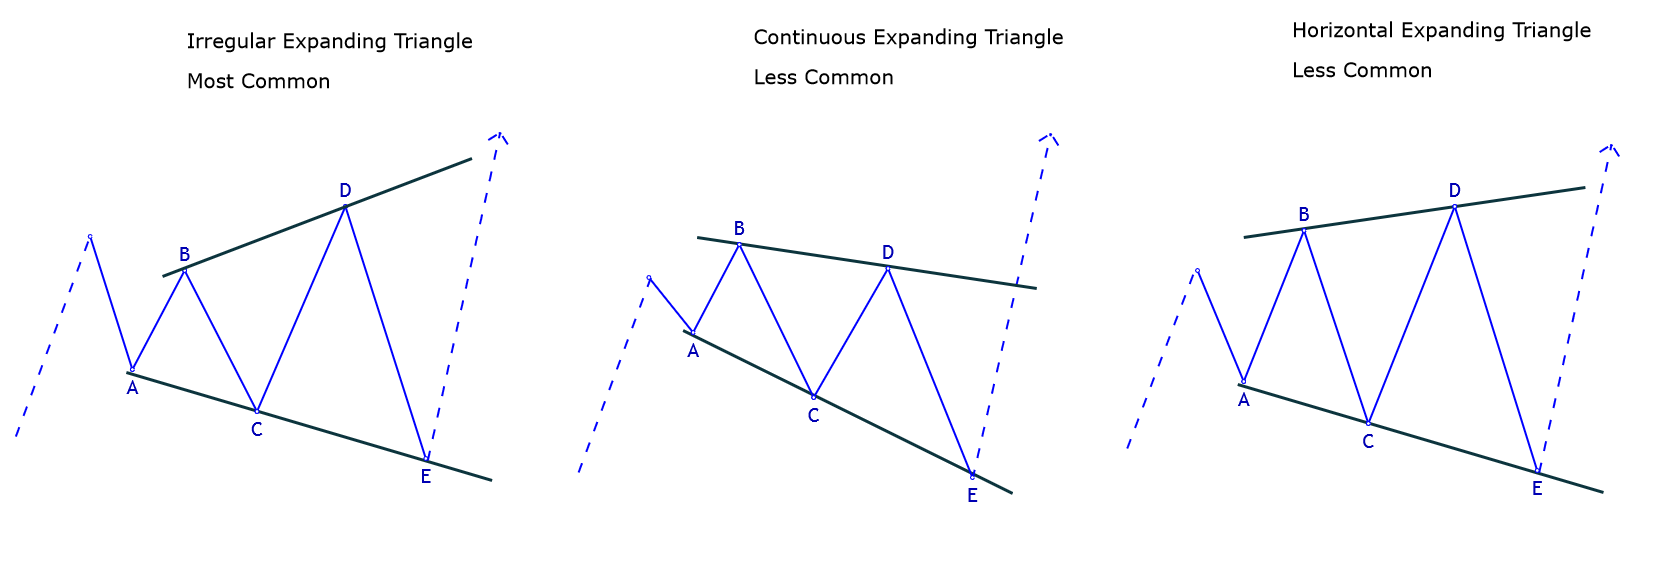
The Horizontal Expanding Triangle
The Horizontal Expanding Triangle is generally regarded as the rarest expanding triangle to occur on the charts. The reason for that is that this particular triangle occurs when the pattern’s expansion occurs in the most “ideal” way possible – not in terms of making a profit, but in terms of the actual process of expansion.
The Horizontal Expanding Triangle would have each and every new wave expand to a larger extent, as compared to all previous waves, congruent with our explanation of the basics of an expanding triangle. Naturally, this assumes a large number of price changes and fluctuations, which itself would imply the largest possible danger. This kind of scenario would take place when there is a lot of upheaval on the market, with many people being in a state of uncertainty.
The Irregular Expanding Triangle
As you may infer from the very name itself, this triangle does form in an unexpected and unnatural pattern. In this particular case, as an example, the b-wave in this pattern will be considerably smaller than all other waves, as opposed to all waves being larger than their previous waves.
When compared with the horizontal one, this pattern is much more common, and expectedly is layered in a much more irregular manner. In addition, with the b-wave being smaller, the expansion of the trendlines can be seen quite a bit easier.
The Elliott wave running triangle
The running an expanding triangle, which is the most obscure variant of the triangle that you can encounter in a chart. The curious part is that despite its obscurity, it’s also the most common one you’re likely to encounter. As such, it is very important to have a decent understanding of it, so you can utilize the expanding triangle pattern to its fullest potential.
The running expanding triangle, just like the “regular” one, has the smallest b-wave, and the c-wave that is bigger than the d-wave, and finally, the e-wave that is bigger than the d-wave. This kind of structure may seem a bit strange in the beginning, but in actuality, it makes a lot of things easier.
In general, at the time of a running rising triangle pattern forming, it should be expected that the ends of all these triangles will be either above or below their previous triangle. This is a very surface-level way of explaining how it works, but in actuality, it IS that simple. The formation/shape of the triangle itself will vary depending on the triangle being bullish or bearish, meaning it should be pretty simple and straightforward to notice it as it occurs. As mentioned, these kinds of small details are what separates traders that excel from the ones that don’t. A trader that can predict and know an occurrence of such a rising triangle stock pattern can then gain a huge advantage over many other traders.
Summing it all up – why the Elliott wave triangle rules matter, and 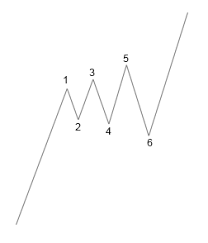 why should you care
By now, you probably already know the exact level of importance that needs to be accrued to the expanding triangle pattern and can appreciate how much of an advantage it can give you. This theory, as mentioned, was thought out by Ralph Nelson Elliott, who maintained that the financial markets are constantly undergoing cycles of patterns – corrective and impulsive patterns – that all ultimately result in stabilizing it; of course with different types of scenarios taking place in-between.
This idea of an expanding triangle continuation pattern triangle is demonstrated on a chart, where, during the changes in prices of the assets, they all move apart from each other. They all consist of five separate legs and three triangles. In this scenario, each wave would be larger than the previous one in an ever-expanding manner, resulting, of course, in high volatility.
However, as we have learned later, there’s actually not one, but three different types of expanding triangles, and some of them, as we have seen, do not fit strictly into this description, but are rather different. The first expanding Elliott wave triangle, the horizontal one, does fit the description because there, each new price wave does become larger than the previous one. However, on the other hand, with the irregular expanding triangle, the b-wave would be smaller than the other waves, and with the running expanding triangle, the a-wave is larger than the b-wave, d-wave would be smaller than the c-wave, and e-wave would also be larger than d-wave.
At the end of the day, having this kind of knowledge, and being able to utilize it, gives you a huge advantage, essentially giving you the ability to be ready for major changes in the prices, and thereby letting you be in a better position before they occur. As mentioned, this is the essence of reaching success with Forex trading. Being able to utilize these small tools to your advantage is precisely what sets you apart from hordes of traders who are simply going with the current.